The problem is not a lack of awareness. Mid-market business owners understand that cyber incidents happen, and they know that inland flooding is the most common and most costly natural disaster in the United States. However, there is often a significant gap between that awareness and having the insurance coverage that actually responds when a loss occurs. That gap is persistent and expensive. Understanding why it exists is more useful than simply acknowledging that it does.

The Cyber Coverage Gap: What the Numbers Show
Only 38% of small and mid-sized businesses currently carry cyber insurance, according to 2026 industry data. Among those that do, a significant portion carry limits that were set before the current cost environment for cyber incidents. Today, the average cost of a ransomware incident for a mid-market company exceeds $1.2 million in total incident costs, including downtime, remediation, ransom payments, and regulatory response, according to the Ransomware Task Force’s 2026 annual report.
Three specific coverage gaps characterize the mid-market cyber exposure in 2026.
Business interruption sublimits: Standard cyber policies frequently include sublimits on business interruption coverage that are significantly lower than the total policy limit. A $2 million cyber policy with a $250,000 business interruption sublimit provides minimal protection against the income loss that typically represents the largest financial component of a ransomware incident. The sublimit is established when the policy is issued based on the underwriter’s assumptions about the average duration of a business interruption. Those assumptions often do not reflect the actual recovery timelines that mid-market companies experience when their operational systems are encrypted.
Social engineering and funds transfer fraud:Business email compromise, which involves fraudulent wire transfers initiated through impersonated executive or vendor email, generated $2.9 billion in reported losses in 2023, according to the FBI’s IC3. Standard cyber policies vary significantly in whether and how they cover funds transfer fraud. Coverage is typically written as a sublimit within the cyber policy and may require specific security controls to have been in place at the time of the loss. Businesses that have not verified how their cyber policy responds to a BEC loss, which involves a fraudulent wire transfer rather than a network intrusion, may be relying on an assumption that is not supported by their policy language.
Supply chain cyber incidents: A cyber attack that originates with a vendor, supplier, or software provider and then spreads to the insured’s systems presents a different coverage question from a direct attack. Contingent cyber coverage, which is the cyber equivalent of contingent business interruption coverage, addresses losses resulting from a cyber event at a third party whose systems the insured relies on. Very few mid-market cyber policies include meaningful contingent cyber coverage. The SolarWinds and MOVEit incidents demonstrated how extensively supply chain cyber events can affect organizations that were not the direct target.
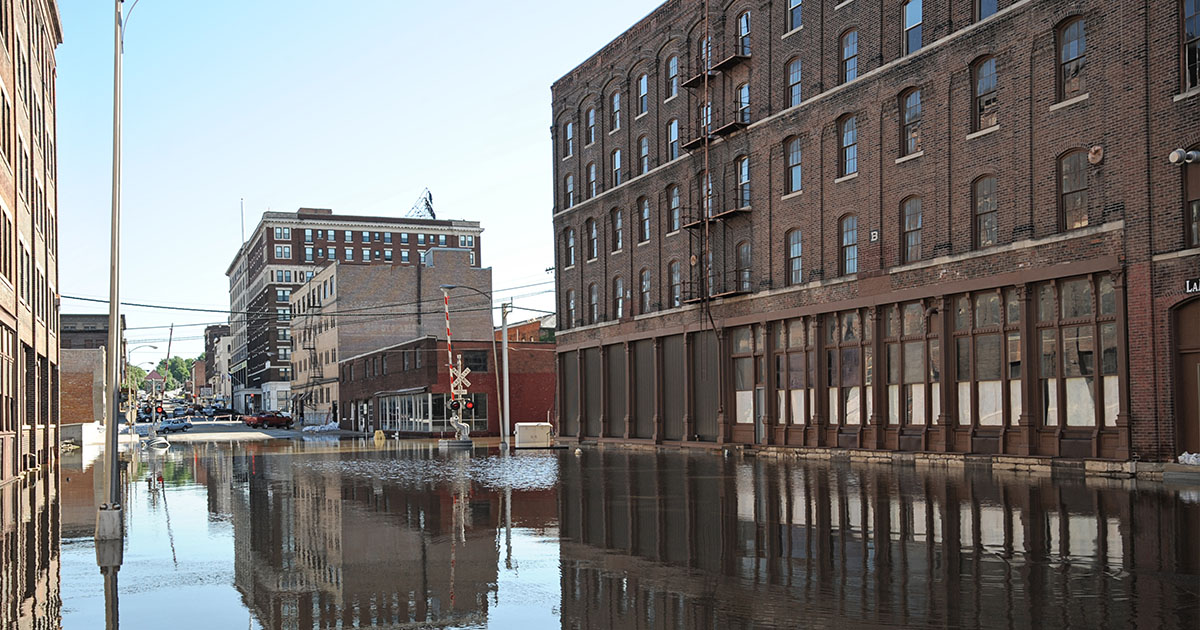
The Inland Flood Gap: Persistent and Predictable
Standard commercial property policies exclude flood coverage. This is not a surprising provision buried in the policy’s exclusion language. It is a fundamental characteristic of commercial property insurance that has been in place for decades. Flood coverage requires either a separate flood insurance policy or a specific flood endorsement to the commercial property policy. Despite this being widely understood, the commercial flood insurance take-up rate among mid-market businesses in high-risk flood zones remains below 40%, and among businesses outside designated FEMA flood zones, it falls to approximately 10 to 15%.
The designated flood zone framework is itself a coverage gap driver. FEMA’s flood maps are updated infrequently and frequently understate risk, particularly for inland flooding driven by intense rainfall events rather than coastal storm surge. A business located outside a FEMA Special Flood Hazard Area has no mandatory insurance requirement and often concludes that its flood risk is low enough to self-retain. The data does not support that conclusion. In recent major inland flood events, the majority of damaged properties were outside designated high-risk zones.
Two additional inland flood coverage questions deserve specific attention at renewal. The first is the difference between NFIP commercial coverage and private flood insurance: NFIP commercial policies cap building coverage at $500,000 and contents coverage at $500,000, with no business interruption component. Private flood markets offer higher limits, broader coverage triggers, and business income coverage that the NFIP program does not provide. The second is the waiting period: NFIP policies have a 30-day waiting period before coverage takes effect. Private market policies vary. Both waiting periods mean that flood coverage purchased after a storm is forecast provides no protection against that storm.
Why Coverage Gaps Persist Despite Awareness
Many business owners know that cyber incidents and floods can disrupt operations. Yet that awareness does not always lead to a review of their insurance coverage. Three common factors help explain why.
Optimism bias. An owner may recognize a risk in general but believe their own business is unlikely to experience it. That can make cyber or flood coverage seem less urgent than other priorities.
Renewal habits. It is easy to renew a familiar insurance program without revisiting how the business has changed. If a gap existed when the coverage was first purchased, it may carry forward year after year.
Coverage complexity. Policy terms, exclusions and limits can be difficult to assess without a careful review. Business owners may assume their property or cyber coverage addresses an exposure that the policy actually limits or excludes.
Tooher-Ferraris reviews commercial insurance programs to identify potential cyber and flood coverage gaps, compare available options and help businesses align coverage with their actual exposures. Learn more about our commercial insurance services and specialty programs.
For more information on these risks, explore the FBI’s Internet Crime Complaint Center, FEMA’s flood resources and the Insurance Information Institute.
Frequently Asked Questions
Does my commercial property policy cover flood damage?
Standard commercial property policies exclude flood coverage. A separate flood insurance policy, either through the National Flood Insurance Program or the private flood insurance market, is generally required to cover flood losses. This applies regardless of whether the property is located in a FEMA-designated flood zone.
What is the difference between NFIP commercial coverage and private flood insurance?
NFIP commercial coverage caps building coverage at $500,000 and contents at $500,000, with no business interruption coverage and a 30-day waiting period. Private flood insurance offers higher limits, broader coverage triggers, business income coverage, and in some cases shorter or no waiting periods. For businesses with property values or business interruption exposure that exceeds NFIP limits, private flood insurance provides more comprehensive protection.
What cyber coverage gaps are most commonly missed by mid-market businesses?
The three most commonly missed gaps are: business interruption sublimits that are significantly lower than the total policy limit; limited or absent social engineering and funds transfer fraud coverage; and the absence of contingent cyber coverage for losses caused by incidents at vendors or suppliers. Each of these should be specifically confirmed with the broker rather than assumed to be included.
Ready to review your cyber and flood coverage gaps? The team at Tooher-Ferraris has been helping businesses identify and close coverage gaps since 1932. Contact us today to schedule a no-obligation consultation — https://toofer.com/contact-us/